eSimMon
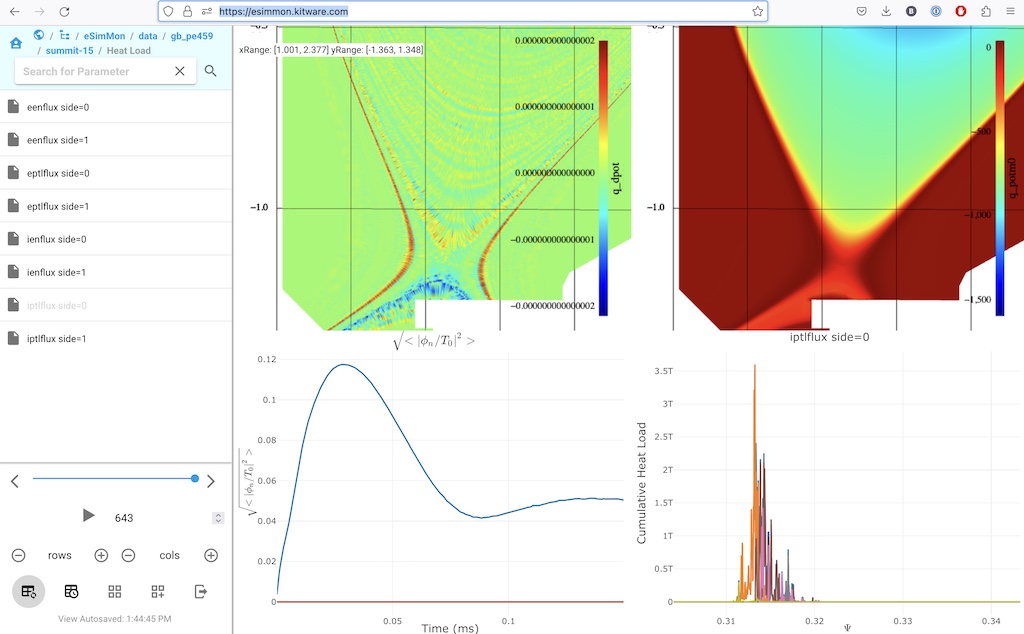
eSimMon is Web application for managing and visualization data extracts generated through analysis and visualization of simulation results. Data extracts supported by eSimMon include:
- 1D line charts (rendered using plotly)
- 2D plots (rendered using vtk.js)
- 2D mesh plots (rendered using vtk.js)
- images
Data extracts can be generated by the workflow tool EFFIS and the in situ library ParaView Catalyst. A Python library to generate/convert data extracts is also in progress. Once generated, these extracts are then uploaded to the eSimMon database and can then be immediately displayed making eSimMon a convenient tool for monitoring the results of simulations in progress.
Each eSimMon dashboard offers limited access control where all authorized users are able to access all of the data extracts. Therefore, we recommend that a separate instance is deployed for each simulation community that would like to share the results from their simulations runs.